Businesses today rely on data-driven decisions more than ever before. Whether you're running a SaaS platform, a consulting agency, a healthcare organization, or an enterprise application, your customers expect easy access to interactive dashboards and real-time insights.
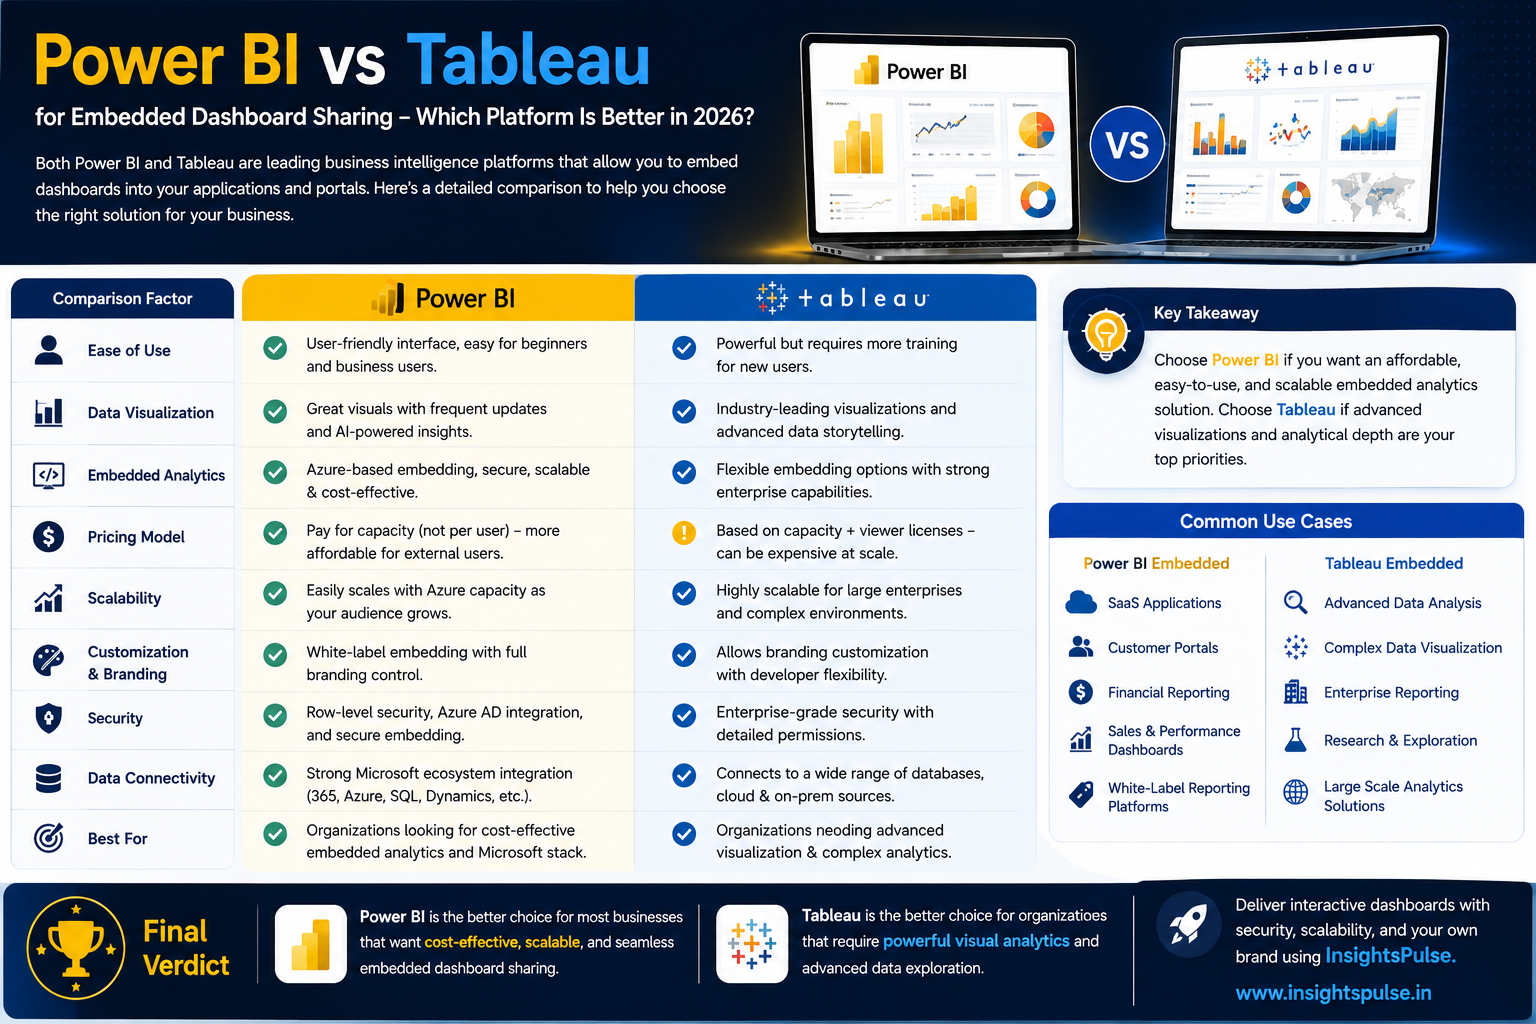
When it comes to embedded analytics, Power BI and Tableau are two of the most popular business intelligence platforms available. Both allow organizations to integrate dashboards into websites, portals, and applications, but they differ significantly in terms of pricing, usability, scalability, and deployment.
So, which platform is the better choice for embedded dashboard sharing?
In this comprehensive comparison, we'll examine Power BI vs Tableau across the factors that matter most, helping you choose the right solution for your business.
Why Embedded Analytics Matters
Modern businesses no longer want users to log into separate reporting tools. Instead, they embed dashboards directly into customer portals, CRMs, ERPs, SaaS platforms, and websites.
Embedded analytics provides several advantages:
- Better customer experience
- Faster decision-making
- Stronger product value
- Secure report sharing
- White-label branding
- Centralized user management
Both Power BI and Tableau support embedded analytics, but they approach it differently.
What Is Power BI Embedded?
Power BI Embedded is Microsoft's Azure-based service that enables businesses to integrate interactive Power BI dashboards into custom applications.
Rather than purchasing licenses for every external user, organizations pay for Azure capacity, making it an attractive option for customer-facing analytics.
Power BI Embedded is commonly used for:
- SaaS applications
- Customer portals
- Franchise dashboards
- Financial reporting
- Sales analytics
- White-label reporting platforms
Its seamless integration with the Microsoft ecosystem makes it particularly appealing to organizations already using Microsoft 365, Azure, or Dynamics 365.
What Is Tableau Embedded?
Tableau Embedded Analytics allows businesses to integrate Tableau dashboards into their applications, websites, or customer portals.
Known for its advanced visualization capabilities, Tableau helps organizations create highly interactive dashboards while maintaining enterprise-level security.
Tableau is widely used across industries such as:
- Healthcare
- Retail
- Manufacturing
- Education
- Finance
- Government
Organizations that prioritize advanced data exploration often prefer Tableau for its rich visualization options.
Power BI vs Tableau: Feature Comparison
1. Ease of Use
Power BI
Power BI offers a familiar interface, especially for users already working with Excel or other Microsoft products. It has a shorter learning curve and allows businesses to create dashboards quickly.
Tableau
Tableau provides powerful drag-and-drop analytics and advanced visualization capabilities. While flexible, it generally requires more training for new users.
Winner: Power BI for beginners and business users.
2. Data Visualization
Visualization is where Tableau has traditionally excelled.
It offers:
- Highly customizable charts
- Advanced visual storytelling
- Rich mapping features
- Sophisticated analytics
Power BI also provides excellent visualizations and continues to improve with frequent updates, making it suitable for most business reporting needs.
Winner: Tableau for advanced visualization.
3. Embedded Dashboard Sharing
Both platforms allow businesses to embed dashboards into applications.
Power BI Embedded
- Azure-based infrastructure
- Secure authentication
- White-label experience
- Cost-effective for many external users
- Strong Microsoft integration
Tableau Embedded
- Flexible embedding options
- Enterprise-grade security
- Extensive customization
- Excellent dashboard interactivity
Winner: Tie, depending on your business requirements.
4. Pricing
Pricing is often one of the biggest deciding factors.
Power BI
Power BI Embedded uses Azure capacity-based pricing, allowing businesses to scale resources as demand grows.
This model can significantly reduce costs for organizations serving large numbers of external users.
Tableau
Tableau's licensing structure is generally more expensive, especially for organizations with large deployments and embedded analytics requirements.
For businesses seeking predictable and scalable costs, Power BI often offers better value.
Winner: Power BI.
5. Integration
Power BI
Power BI integrates seamlessly with:
- Microsoft Azure
- Microsoft 365
- Excel
- SQL Server
- Dynamics 365
- SharePoint
- Teams
Tableau
Tableau connects with numerous cloud platforms, databases, and third-party applications, offering excellent flexibility for organizations with diverse data sources.
Winner: Power BI for Microsoft-centric businesses; Tableau for broader ecosystems.
6. Security
Both Power BI and Tableau offer enterprise-grade security features.
These include:
- Row-level security
- User authentication
- Role-based permissions
- Data encryption
- Audit logs
Organizations can confidently deploy either platform while maintaining strict data governance.
Winner: Tie.
7. Scalability
As businesses grow, scalability becomes essential.
Power BI Embedded allows organizations to increase Azure capacity based on usage, making it ideal for growing customer bases.
Tableau also supports enterprise-scale deployments but often requires more complex licensing considerations.
Winner: Power BI.
Power BI vs Tableau: Quick Comparison
Feature | Power BI Embedded | Tableau Embedded |
Ease of Use | ⭐⭐⭐⭐⭐ | ⭐⭐⭐⭐ |
Data Visualization | ⭐⭐⭐⭐ | ⭐⭐⭐⭐⭐ |
Pricing | ⭐⭐⭐⭐⭐ | ⭐⭐⭐ |
Microsoft Integration | ⭐⭐⭐⭐⭐ | ⭐⭐⭐ |
White-Label Support | Yes | Yes |
Security | Excellent | Excellent |
Scalability | Excellent | Excellent |
External Dashboard Sharing | Excellent | Excellent |
Which Platform Is Best for Your Business?
Choose Power BI Embedded if you:
- Already use Microsoft products.
- Need cost-effective embedded analytics.
- Want faster implementation.
- Serve large numbers of external users.
- Require white-label dashboard sharing.
- Need scalable Azure-based infrastructure.
Choose Tableau if you:
- Require advanced visual storytelling.
- Work with highly complex analytics.
- Need extensive visualization customization.
- Have experienced Tableau developers.
- Prioritize deep exploratory analysis.
How InsightsPulse Supports Both Platforms
Selecting the right BI platform is only part of the equation. Businesses also need a secure and user-friendly way to deliver dashboards to customers.
InsightsPulse simplifies embedded analytics by providing a powerful white-label portal that supports both Power BI and Tableau, helping organizations:
- Securely share dashboards with external users
- Eliminate complex user management
- Deliver branded analytics experiences
- Control access with role-based permissions
- Reduce development time
- Simplify report distribution
- Scale analytics as the business grows
Whether your organization uses Power BI or Tableau, InsightsPulse enables seamless dashboard sharing through a professional, secure platform.
Best Practices for Embedded Dashboard Sharing
To maximize the value of embedded analytics:
- Use role-based access controls.
- Implement row-level security for sensitive data.
- Optimize dashboards for fast loading.
- Monitor user activity regularly.
- Design responsive dashboards for mobile users.
- Keep embedded reports updated with the latest data.
- Choose a scalable deployment model that supports future growth.
Following these practices ensures a secure and reliable experience for both administrators and end users.
Conclusion
Both Power BI Embedded and Tableau Embedded are powerful platforms for delivering interactive analytics to customers, partners, and stakeholders. The right choice depends on your organization's priorities.
If affordability, scalability, and Microsoft integration are your primary concerns, Power BI Embedded is an excellent choice. If your focus is advanced visualizations and sophisticated data exploration, Tableau may better suit your needs.
- Securely share dashboards with external users