Many US businesses already use Tableau for sales, finance,
operations, customer behavior and executive reporting. The next challenge is
often how to share those dashboards with customers, partners or external users
in a controlled and professional environment.
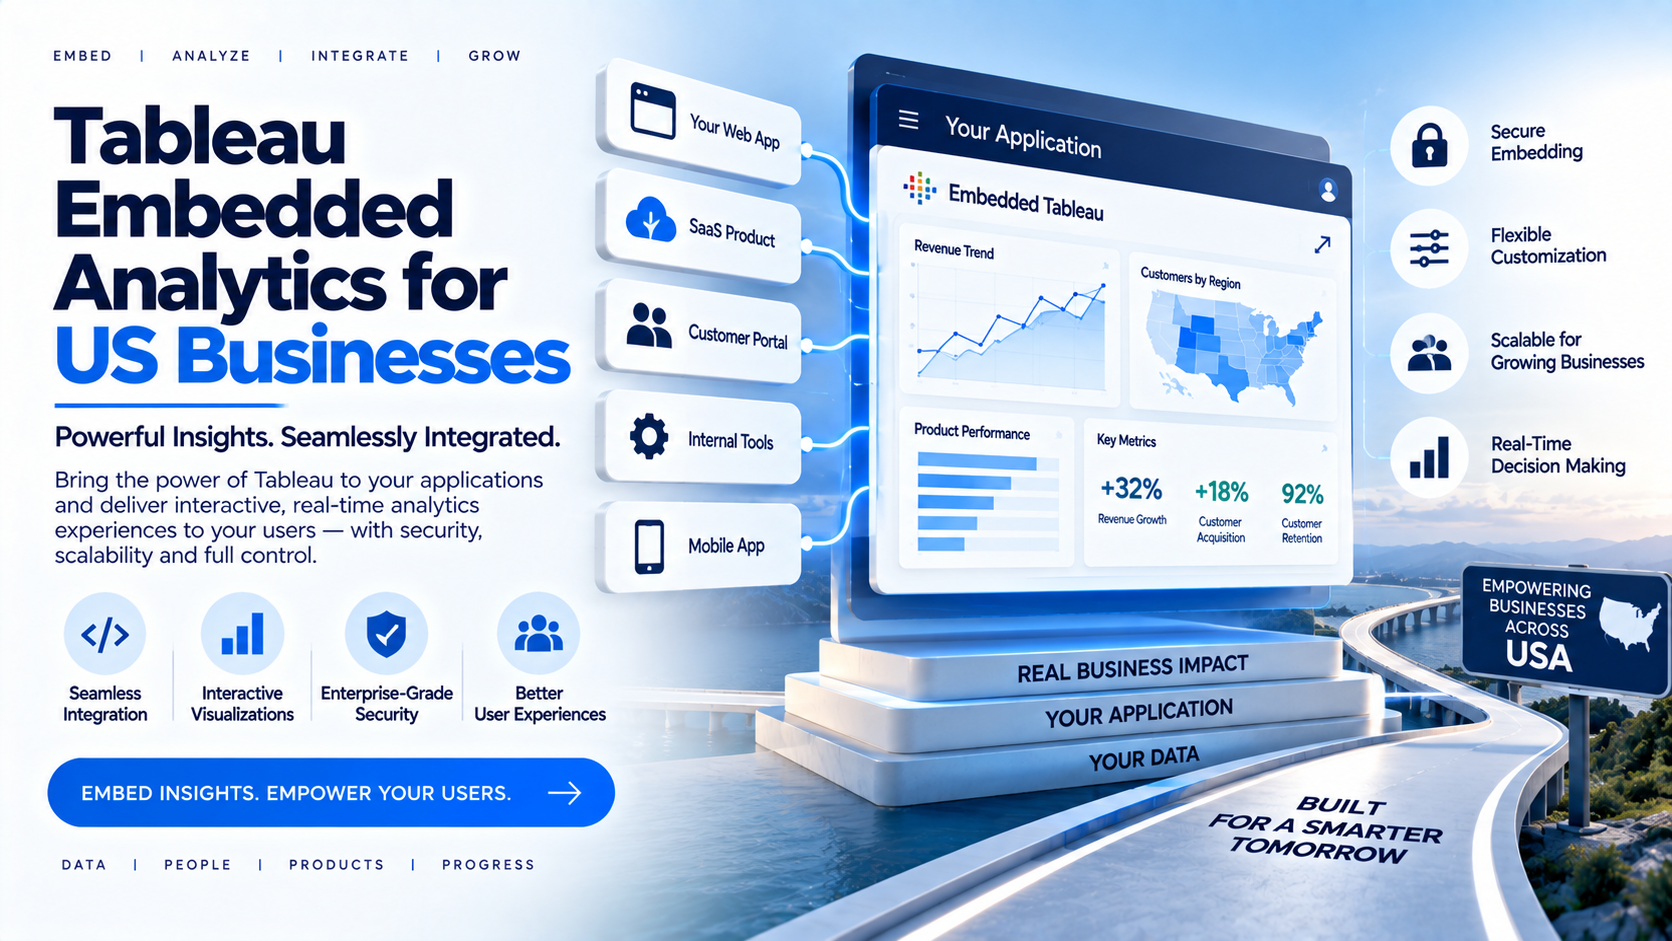
Tableau embedded analytics can place interactive reporting
inside a website, application or portal. A compatible white-label delivery
layer may also help organizations manage branding, user access and dashboard
organization. This guide explains the architecture, use cases, security
questions, performance factors, cost considerations and selection criteria
businesses should review.
What Is Tableau Embedded Analytics?
Tableau embedded analytics refers to integrating Tableau
views or dashboards into another digital experience, such as a website,
application, customer portal or internal system. The goal is to make analytics
available in the workflow where users already work.
Embedding is different from simply sending a dashboard URL.
The experience may require authentication, user-specific permissions,
filtering, navigation controls and integration with the host application. The
exact options depend on the Tableau product, deployment method and licensing
model.
Why US Businesses Embed Tableau?
Organizations embed Tableau for several reasons. A SaaS
company may want customers to see usage or performance analytics inside its
product. A consulting firm may provide interactive dashboards as part of a
client engagement. A manufacturer may share operational data with distributors,
while a franchise organization may provide location-level reporting.
Embedding can reduce friction by placing analytics closer to
the user’s existing workflow. It can also create a more consistent experience
when dashboards are delivered through a branded portal rather than through
separate links and tools.
Common Use Cases
Common use cases include customer reporting, partner
analytics, executive dashboards, franchise performance, financial reporting,
healthcare operations, supply-chain monitoring, education analytics and
internal departmental applications.
The use case determines the access model. Internal employees
may use an organization-based identity model, while external customers may
require an application-owned or portal-managed experience. Businesses should
document the audience, number of users, frequency of access and sensitivity of
the data before selecting an architecture.
White-Label Tableau Dashboard Sharing
A white-label portal can provide a branded access layer
around Tableau dashboards. Depending on the platform, this may include logo and
color customization, custom domains, branded navigation, email identity and
organized report access.
The portal should not be treated as a replacement for
Tableau security. Instead, it should work with the underlying platform’s
permissions and data-protection controls. Businesses should confirm which
branding features are supported and whether the desired experience requires
custom development.
Security and Permissions
Security planning should begin with the data model and user
relationships. Determine whether users are employees, customers, partners or
anonymous visitors. Then define authentication, roles, report access,
filtering, data isolation and administrative responsibilities.
Test whether a user can access another organization’s data
through a modified URL, filter, export or embedded view. Review how users are
added and removed, how permissions are audited and how credentials or tokens
are protected. Never assume that hiding a navigation item alone provides
adequate security.
Tableau Embedded vs Direct Links
Direct links may be suitable for limited internal use, but
they may provide less control over branding, user onboarding, report
organization and customer workflows. An embedded experience or centralized
portal can create a more connected environment.
The best approach depends on the audience, security
requirements, existing application architecture, licensing model and desired
user experience. Businesses should compare the operational simplicity of direct
access with the control and integration needs of embedded delivery.
Performance and User Experience
Performance depends on multiple layers, including the
dashboard design, data sources, calculations, filters, network conditions,
hosting environment and user traffic. A visually attractive dashboard can still
create a poor experience if it contains too many charts, complex calculations
or inefficient queries.
Before launch, test loading speed, filtering, navigation,
mobile or responsive behavior, concurrency and common user journeys. Use
representative dashboards rather than a simplified demo. Establish performance
expectations and monitor the experience after deployment.
Licensing and Cost Considerations
The cost of Tableau embedded analytics may include Tableau
licensing, hosting or capacity, portal subscription, implementation,
customization, support and ongoing administration. Requirements vary according
to the Tableau product and deployment model.
Do not make assumptions about viewer licensing or external
access. Confirm the current terms with Tableau and the selected platform. Build
a cost model that includes the expected number of users, dashboards, data
sources, usage patterns and future growth.
Supporting Multiple Analytics Technologies
Some businesses use Tableau as their primary platform, while
agencies and service providers may support multiple technologies. A platform
that supports Power BI, Tableau, Looker Studio and HTML dashboards can help
reduce fragmentation when different clients or departments use different tools.
InsightsPulse is positioned to support several dashboard
formats through a centralized portal. Organizations should validate
compatibility with their specific dashboard configuration, authentication
approach and licensing requirements before committing to a production rollout.
How to Evaluate a Tableau Analytics Portal?
Ask vendors to demonstrate dashboard embedding,
authentication, report assignment, user provisioning, permission changes,
branding, custom domain support, filtering, exports and error handling. Ask how
the platform handles inactive users, additional customers and changes to the
underlying Tableau environment.
A proof of concept should include at least two user groups
and one restricted dashboard. The evaluation should test both successful access
and denied access. It should also document which responsibilities remain with
the customer, Tableau administrator and portal provider.
Why InsightsPulse?
InsightsPulse is designed to provide a centralized
environment for dashboard delivery and management. Its stated positioning
includes Tableau and Power BI embedding, white-label branding, user and report
management and access-control capabilities.
The most useful next step is to evaluate the platform using
actual dashboards and a realistic access hierarchy. Confirm supported Tableau
integration methods, licensing responsibilities, security controls, performance
expectations and pricing before production deployment.
Conclusion
Tableau embedded analytics can help US businesses bring
interactive reporting closer to customers, partners and employees. A secure and
branded delivery environment can improve usability and administration, but
success depends on careful architecture, permission design, performance testing
and licensing validation.
Businesses should choose an approach that balances user
experience, security, flexibility and total ownership cost. A small,
well-tested pilot can expose integration and access issues before a wider
rollout.
Frequently Asked Questions
What is Tableau embedded analytics?
It is the integration of Tableau dashboards or views into
another application, portal or digital experience.
Can Tableau dashboards be shared through a white-label portal?
A compatible platform can provide a branded delivery
environment, subject to integration and licensing requirements.
Do Tableau viewers need individual licenses?
Requirements depend on the Tableau deployment and licensing
model. Confirm the current terms with Tableau and the selected provider.
What should be tested before launch?
Test authentication, permissions, data visibility,
filtering, performance, responsive viewing, exports and user workflows.
Can a portal support Tableau and Power BI?
Some platforms support multiple dashboard technologies.
Confirm compatibility and feature support for the intended environment.
If your organization needs a more professional way to share dashboards, manage users and deliver branded analytics, explore InsightsPulse. Review the available features, test your reporting workflow and discuss your requirements with the team before deployment.