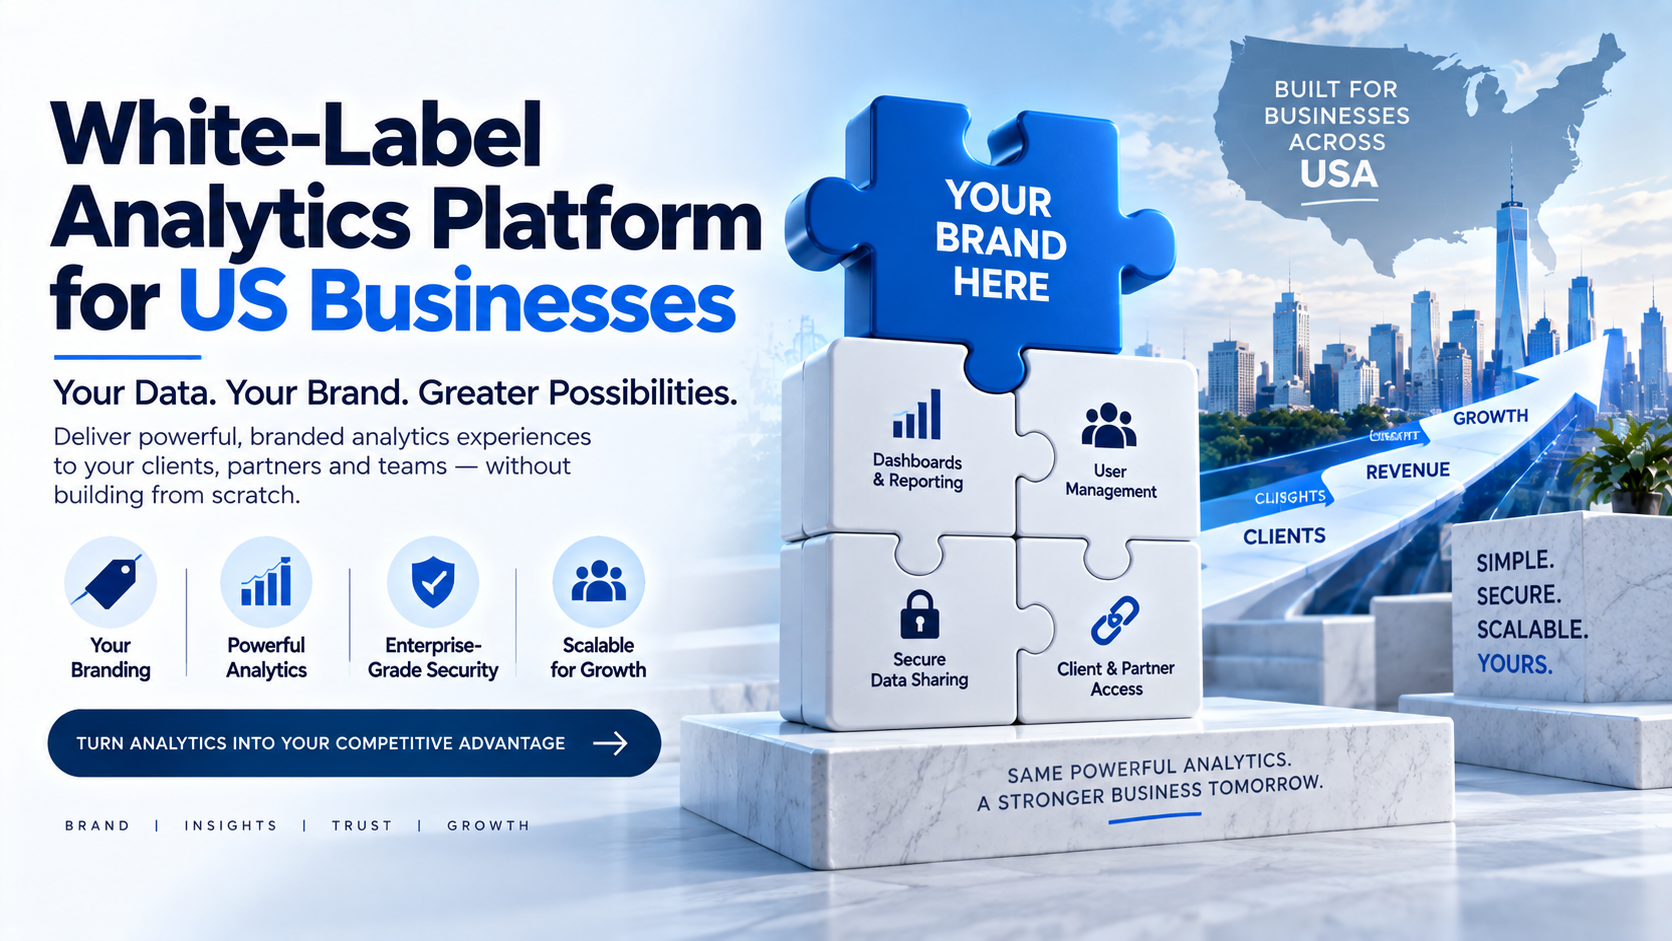
For many US businesses, analytics is no longer limited to
internal spreadsheets or executive presentations. Companies increasingly need
to share dashboards with customers, partners, franchisees, consultants, vendors
and distributed teams. However, sending PDF reports or third-party dashboard
links can create a disconnected experience and increase administrative work. A
white-label analytics platform addresses this challenge by providing a branded
environment where dashboards, users and reporting access can be managed in one
place.
The right platform should do more than display a logo. It
should support a reliable customer experience, appropriate authentication,
report permissions, dashboard integrations, user administration, scalability
and a clear operational workflow. This guide explains the major features,
benefits, costs, security considerations and selection criteria for US
businesses evaluating a white-label analytics solution.
What Is a White-Label Analytics Platform?
What Is a White-Label Analytics Platform?
A white-label analytics platform is a reporting portal that
can be presented under a business’s own brand instead of exposing the identity
of the underlying analytics or software provider. Depending on the product,
branding may include a company logo, color palette, custom domain, email
identity, navigation, login experience and other interface elements.
The platform generally sits between the reporting technology
and the end user. It can provide a structured place for users to sign in,
locate their dashboards and access only the content they are authorized to
view. The underlying reports may be created in Power BI, Tableau, Looker Studio
or another supported technology.
White-label delivery is especially relevant when analytics
is part of a service offering. A marketing agency, SaaS provider, consulting
firm or data services company may want customers to experience reporting as
part of its own product or service rather than as an unrelated external tool.
Why US Businesses Are Investing in White-Label Analytics?
US businesses often operate across multiple departments,
customer accounts, locations and stakeholder groups. This creates practical
reporting challenges: different users need different dashboards, clients need
controlled access, administrators need to update permissions and leadership
wants a consistent view of performance.
A branded portal can help organize this process. Instead of
distributing multiple links and files, the organization can provide one
recognizable access point. Users may be able to find their assigned reports,
while administrators manage access centrally. This can reduce confusion and
create a more professional experience during client onboarding, monthly reviews
and ongoing service delivery.
White-label analytics can also support differentiation. When
reporting is included in a consulting, software or managed-service package, the
reporting experience becomes part of the perceived value of the overall
offering.
Core Features to Evaluate
A serious platform evaluation should cover both visible
features and operational capabilities. Important areas include:
• Branding: logo, colors, portal appearance, favicon, custom
domain and branded communication where available.
• Dashboard support: Power BI, Tableau, Looker Studio/Google Data Studio, HTML
dashboards or other required formats.
• User management: invite, deactivate, update and organize users.
• Role-based access: assign different permissions to administrators, managers,
clients and viewers.
• Report management: assign dashboards by user, team, organization or account.
• Authentication: login workflows, password policies, SSO or other supported
identity options.
• Responsive experience: usable navigation on desktops, tablets and suitable
mobile screens.
• Administration: visibility into users, reports, subscriptions, access and
configuration.
• Scalability: ability to support additional users, dashboards, clients and
reporting workloads.
Businesses should test these features using real scenarios
instead of relying only on a product presentation.
Branding and Customer Experience
Brand consistency matters when customers interact with an
analytics portal repeatedly. A portal that matches the organization’s colors,
terminology and domain can feel like a natural extension of the company’s
website or product. This is particularly useful for agencies and SaaS
businesses that want to strengthen their own customer relationship.
However, branding should not be considered only a visual
exercise. The customer experience also depends on clear navigation, meaningful
dashboard names, simple access instructions, predictable login behavior and
fast access to relevant reports. A beautifully branded portal can still perform
poorly if users cannot find the right dashboard or do not understand the
metrics.
Before launch, create a short onboarding flow: explain how
users sign in, where they find reports, how filters work and who they should
contact for access problems.
Security and Permission Planning
White-label branding does not automatically make a reporting
environment secure. The business must design authentication, authorization and
data access carefully. A user should receive only the dashboards and records
appropriate for their role, organization and business relationship.
Relevant questions include: Are users separated by customer
or department? Can an administrator accidentally assign the wrong report? Does
the underlying BI platform use row-level security or another filtering method?
How are inactive users removed? Is access reviewed periodically? Are links
protected, and are public-sharing options disabled when they are not
appropriate?
Security requirements should be documented before
implementation. Test the system with multiple sample accounts, including an
administrator, a normal user and users belonging to different customer
organizations. Review both portal-level permissions and the permissions
configured inside the underlying reporting platform.
Power BI, Tableau and Multi-Platform Reporting
Many organizations standardize on one analytics technology,
but agencies and service providers may need to support several. A platform that
supports multiple dashboard formats can reduce the need to create separate
delivery systems for different clients.
InsightsPulse is positioned to support Power BI, Tableau,
Google Data Studio/Looker Studio and HTML dashboards through a centralized
analytics portal. This can be useful when one client uses Power BI, another
uses Tableau and a third needs a custom HTML dashboard. The exact integration
process, supported features and licensing obligations should be verified for
each environment before production deployment.
Common Use Cases
White-label analytics can support a range of business
models:
1. Marketing and advertising agencies can provide branded
campaign and performance reporting to clients.
2. SaaS companies can deliver customer-facing dashboards as part of their
product experience.
3. Consulting firms can share project, financial, operational or transformation
metrics.
4. Franchise organizations can provide location-level and group-level
performance views.
5. Financial and professional service firms can share controlled reports with
clients or partners.
6. Managed service providers can offer analytics as a recurring service
component.
7. Internal enterprise teams can create a consistent reporting experience for
departments and regional offices.
Each use case requires a different access model, so the
platform should be selected based on actual user and data relationships.
Build vs Buy: Which Approach Is Practical?
Building a custom analytics portal can provide deep control
over interface, workflows and integration. It may be appropriate for
organizations with a strong engineering team, specialized product requirements
and a long-term need to own every component.
The cost of building is broader than writing a front end.
Teams may need to implement authentication, user provisioning, dashboard
embedding, report assignment, permissions, tenant separation, monitoring, error
handling, support workflows and security testing. These components also require
maintenance as browsers, identity providers, BI platforms and business
requirements change.
Buying a platform can reduce initial development effort and
shorten time to market. The trade-off is that the business must work within the
platform’s supported features, pricing structure and integration model. A
structured proof of concept is often the best way to compare both approaches.
Cost Factors and Total Ownership
White-label analytics pricing may depend on the number of
users, clients, dashboards, data sources, branding requirements, support level,
integrations and usage volume. Additional costs may come from the underlying BI
platform, capacity, hosting, implementation, customization and internal
administration.
Do not compare subscription prices in isolation. Estimate
the total cost of ownership over 12–24 months. Include development time,
onboarding, support tickets, permission maintenance, report updates, security
reviews and expected growth. Ask whether pricing is based on named users,
active users, tenants, sessions, capacity or another measure.
A platform that appears inexpensive at a small scale may
become less suitable if its pricing model becomes difficult to forecast as
users or customers increase.
How to Choose the Right Platform
Use a weighted evaluation checklist based on business
priorities. Confirm dashboard compatibility first, then examine security and
access controls. After that, review branding, user management, scalability,
performance, support and pricing.
Request a demonstration with your own sample dashboard. Ask
the vendor to show how a new customer is added, how a user is restricted to a
specific report, how an employee is deactivated and how branding is changed.
Also ask what happens when a dashboard fails, a license changes or a customer
needs additional users.
A successful selection should balance user experience,
security, operational simplicity and long-term cost.
Why InsightsPulse May Be Relevant
InsightsPulse is designed as a centralized analytics portal
for sharing dashboards and reports through a branded environment. Its
positioning includes support for Power BI, Tableau, Google Data Studio/Looker
Studio and HTML dashboards, along with white-label branding, user management,
report management and access-control capabilities.
Organizations should evaluate InsightsPulse against their
specific dashboard architecture, user hierarchy, branding requirements and
licensing situation. Before going live, test the complete workflow from user
creation to dashboard access, permission changes and account deactivation. A
product trial or demonstration can help confirm whether the platform fits the
intended use case.
Conclusion
For US businesses, a white-label analytics platform can
combine professional branding, centralized reporting access and better control
over user experiences. The strongest results come when branding, dashboard
design, security, permissions and operational processes are planned together.
Businesses should avoid selecting a platform based only on
screenshots or a low starting price. Instead, test realistic workflows, verify
integrations and calculate the full cost of ownership. With the right approach,
a branded analytics portal can become a scalable part of a company’s customer
service, product or reporting strategy.
Frequently Asked Questions
What is a white-label analytics platform?
It is a customizable analytics portal that allows a business
to deliver dashboards through its own branding and user experience.
Who needs white-label analytics?
Agencies, SaaS companies, consultants, managed-service
providers and organizations sharing dashboards with external users can benefit.
Can Power BI and Tableau dashboards be white-labeled?
A compatible portal can provide a branded delivery layer for
Power BI and Tableau dashboards, subject to integration and licensing
requirements.
Is white-label analytics automatically secure?
No. Security depends on authentication, authorization,
permissions, data filtering, configuration and ongoing access reviews.
What should be tested before choosing a platform?
Test branding, dashboard loading, user provisioning,
permissions, customer separation, performance, support and pricing at expected
scale.